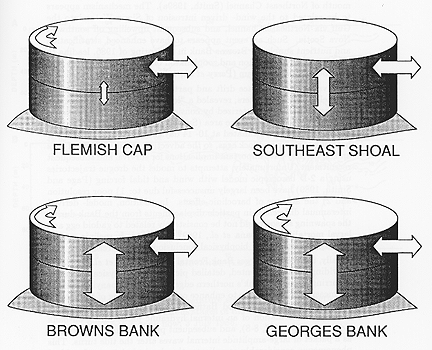
Fig. 8-6. Schematic summary of exchange rate time scales (T) for four submarine banks of eastern Canada. Arrow sizes are proportional to rate ( T-1; see text).

Fig. 8-6. Schematic summary of exchange rate time scales (T) for four submarine banks of eastern Canada. Arrow sizes are proportional to rate ( T-1; see text).