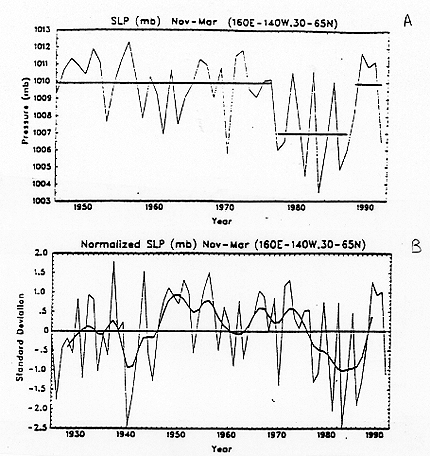
Figure 8. Panel A (top) is the time series of mean North Pacific sea level pressures averaged over 30¡ to 65¡N, 160¡E to 140¡W for the months November through March. Means for 1946-1976 plus 1989-1992 and 1977-1988 are indicated (where 1988 refers to the 1987-88 winter). Panel B (bottom) is the time series of mean North Pacific sea level pressures for November through March, as in panel A, but beginning in 1925 and smoothed with a low pass filter. From Trenberth and Hurrell (1994). (Reproduced with permission.)